Chart js animation example
by admin in Jquery Javascript
Sometimes we need to represent graphs with changes visually, showing data over time, hierarchy, location…
For example gold prices, stocks or any other data you want to see the change easily.
This example article represents 2 data arrays with 100 elements. The input data is taken as random. The following results.
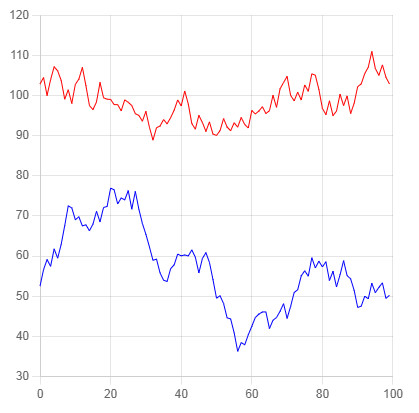
Chart js animation
1. Html:
Using ChartJs library, you can download or link cnd to use.
<script src=”https://cdn.jsdelivr.net/npm/chart.js@4.0.1/dist/chart.umd.min.js”></script>
<div style=”width: 400px; height: 400px”>
<canvas id=”myChart” width=”100%” height=”100%”></canvas>
</div>
2. Script
<script>
var Utils = {
“CHART_COLORS” : {‘red’:’red’, ‘blue’:’blue’}
};
// console.log(‘number’, Utils[“CHART_COLORS”][“red”]);const data1 = [];
const data2 = [];let el1 = 100;
let el2 = 50;// push to data array
for (let i = 0; i < 100; i++) {
el1 += 5 – Math.random() * 10;
data1.push({x: i, y: el1});el2 += 5 – Math.random() * 10;
data2.push({x: i, y: el2});
}const totalDuration = 10000;
const delayBetweenPoints = totalDuration / data1.length;
const previousY = (ctx) => ctx.index === 0 ? ctx.chart.scales.y.getPixelForValue(100) : ctx.chart.getDatasetMeta(ctx.datasetIndex).data[ctx.index – 1].getProps([‘y’], true).y;const animation = {
x: {
type: ‘number’,
easing: ‘linear’,
duration: delayBetweenPoints,
from: NaN, // the point is initially skipped
delay(ctx) {
if (ctx.type !== ‘data’ || ctx.xStarted) {
return 0;
}
ctx.xStarted = true;
return ctx.index * delayBetweenPoints;
}
},
y: {
type: ‘number’,
easing: ‘linear’,
duration: delayBetweenPoints,
from: previousY,
delay(ctx) {
if (ctx.type !== ‘data’ || ctx.yStarted) {
return 0;
}
ctx.yStarted = true;
return ctx.index * delayBetweenPoints;
}
}
};const config = {
type: ‘line’,
data: {
datasets: [{
borderColor: Utils[“CHART_COLORS”][“red”],
borderWidth: 1,
radius: 0,
data: data1,
},
{
borderColor: Utils[“CHART_COLORS”][“blue”],
borderWidth: 1,
radius: 0,
data: data2,
}]
},
options: {
animation,
interaction: {
intersect: false
},
plugins: {
legend: false
},
scales: {
x: {
type: ‘linear’
}
}
}
};var ctx = document.getElementById(‘myChart’).getContext(‘2d’);
var myChart = new Chart(ctx, config, {
config
})
</script>
That is all.


Your comment