Tag: chartjs animation
Chart js animation example
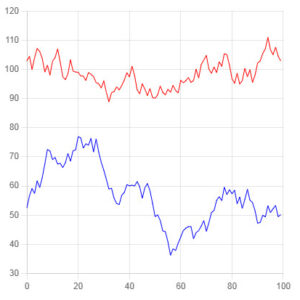
Sometimes we need to represent graphs with changes visually, showing data over time, hierarchy, location… For example gold prices, stocks or any other data you want to see the change easily. This example article represents 2 data arrays with 100 elements. The input data is taken as random. The following results. Chart js animation […]


