Tag: chart js 2.x
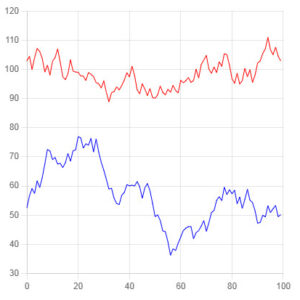
Chart js animation example
Sometimes we need to represent graphs with changes visually, showing data over time, hierarchy, location… For example gold prices, stocks or any other data you want to see the change easily. This example article represents 2 data arrays with 100 elements. The input data is taken as random. The following results. Chart js animation […]
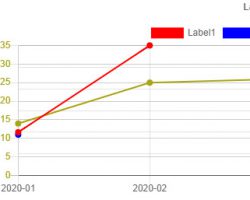
Customizable multi-type, multi-y axis code ChartJS – Part 2
Following the part code of ChartJS 2.x, after part 1 of ChartJS, we discussed the multi-line display of the chart. We continue to present to you some ChartJS modifications that may be required for your requirements in part 2 of this article will edit some more interesting options. In addition to the multi lines, we will […]
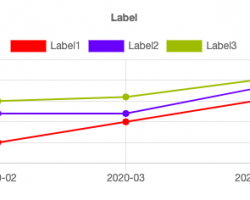
Code Chart JS with multi type – Part 1
We all know how powerful ChartJS 2.x is when it comes to chart rendering, and in some cases ChartJS is more robust when compared to Google Chart. In this content, we will talk about multi-type show in ChartJS. Assuming you are using PHP server, we need json_encode to show in JS. In addition to the […]

