Code Chart JS with multi type – Part 1
by admin in Jquery Javascript
We all know how powerful ChartJS 2.x is when it comes to chart rendering, and in some cases ChartJS is more robust when compared to Google Chart. In this content, we will talk about multi-type show in ChartJS.
Assuming you are using PHP server, we need json_encode to show in JS. In addition to the line chart, you can set up in the form of bar, radar, …
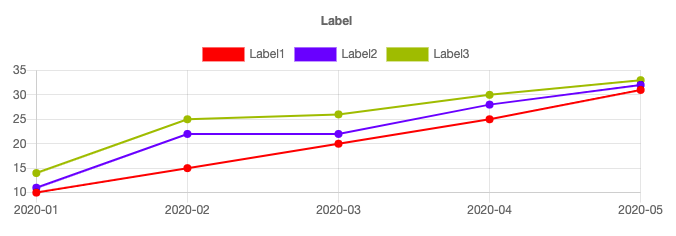
Line chart
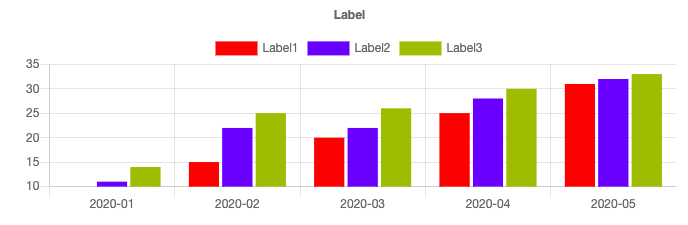
Bar chart
1. Html tag to show chart:
<div class=”chart-container” style=”position: relative; height:auto; width:50%; margin:0 auto”>
<canvas id=”myChart” width=”900″ height=”300″></canvas>
</div>
– Set default data_source get from php:
$data_source = [
“labels” => [
‘2020-01’,
‘2020-02’,
‘2020-03’,
‘2020-04’,
‘2020-05′,
],
“el1” => [
’10’, ’15’, ’20’, ’25’, ’31’
],
“el2” => [
’11’, ’22’, ’22’, ’28’, ’32’
],
“el3” => [
’14’, ’25’, ’26’, ’30’, ’33’
]
];
2. Css:
<style>
canvas{
-moz-user-select: none;
-webkit-user-select: none;
-ms-user-select: none;
}
</style>
3. JS library
<!– // start chartjs –>
<script src=”assets/chartjs/2.13.0moment.min.js”></script>
<script src=”assets/chartjs/2.8.0Chart.min.js”></script>
<script src=”assets/chartjs/utils.js”></script>
4. Map js code to show the chart
var datas = <?php echo json_encode($data_source); ?>;
var ctx = document.getElementById(‘myChart’);
var myChart = new Chart(ctx, {
type: ‘line’,
data: {
labels: datas[“labels”],
datasets: [
{
label: ‘Label1’,
borderColor: window.chartColors.blue,
borderWidth: 2,
fill: false,
data: datas[“el1”],
borderColor : “red”,
backgroundColor : “red”,
lineTension: 0, // strainghtlines
},
{
label: ‘Label2’,
borderColor: window.chartColors.blue,
borderWidth: 2,
fill: false,
data: datas[“el2”],
borderColor : “blue”,
backgroundColor : “blue”,
lineTension: 0, // straightlines
},
{
label: ‘Label3’,
borderColor: window.chartColors.blue,
borderWidth: 2,
fill: false,
data: datas[“el3”],
borderColor : “#a9a518”,
backgroundColor : “#a9a518”,
lineTension: 0,
},]
},
options: {
responsive: true,
title: {
display: true,
text: ‘Label’
},
tooltips: {
mode: ‘index’,
intersect: true
},
annotation: {
annotations: [
{
type: ‘line’,
mode: ‘horizontal’,
scaleID: ‘y-axis-0’,
value: 5,
borderColor: ‘rgb(75, 192, 192)’,
borderWidth: 4,
label: {
enabled: false,
content: ‘Label’
}
}
]
}
}
});
Download full code at here
Size: 119 KB
Readmore: Customizable multi-type, multi-y axis code ChartJS – Part 2
Bài viết liên quan
Chart js animation example
Jquery Javascript
Customizable multi-type, multi-y axis code ChartJS - Part 2
Jquery Javascript


Your comment